Good morning from Arizona. I’ve had a few people ask about how gut health relates to a ketogenic diet. This is a great question and one that I think can be answered best by taking a closer look at my natural koi pond and learning a little about pond scum.
So, sit back and look at the similaries between your gut and how nature balances a pond system: Katch.me
Or you can watch the video below:
The four tenets of health that we touch on above that are essential to understand before you can understand gut health:
The body is a unit and works as such with all parts enhancing the whole
The body is capable of self-regulation, self-healing, and health-maintenance
Structure & function are reciprocally interrelated
Rational treatment of the body must be based upon understanding the principles above and assisting or augmenting those principles
Keys to gut health and pond balancing that we touch on:
Remove the toxins from entering the system like:
Antibiotic overuse
Caffeine
Artificial Fat
Artificial Sweeteners
Repair the system and it’s ability to balance the system
Takes time
Provide structure for the bacteria to which it can bind
Provide essential vitamins and minerals like KetoEnhance & Omega-3 fatty acids
Periodic Fasting
Restore the bacteria or flora of the system
Prebiotics (fermented foods like sauerkraut, kimchi, Japanese natto, etc.)
Probiotics like Dietary KetoBalance (can be purchased in the office)
Replace the salts and pH balance where necessary
Replace electrolytes
Limit things that shift the pH balance
Hope this gives you a starting point for your New Year!!
Today in the office I had the calorie conversation again . . . three times. We have an entire society with a very influential health and fitness industry built around the almighty calorie. Has it helped? Looking at our 5 year obesity outcomes. It hasn’t helped a bit. In fact, it is worse. In 1985 only 19% of U.S. adults were obese.
U.S. Obesity Adult 2011U.S. Adult Obesity 2014
In 2014, 34.5% of U.S. adults were obese. The numbers this year are approaching 35.6% You can see the dramatic increase in obesity by 1-3% every year for the last 5 years in the CDC images above.
For over 50 years we have been told that caloric restriction and fat restriction is the solution. But by the numbers above, the 58 million people in the U.S. utilize a gym or health club to burn off those calories aren’t seeing the success that they should be expecting.
Why? Because the calorie is NOT king. What do I mean by that? We don’t gain weight because of the thermogenic dogma we’ve been taught for the last 50 years. Our weight gain is driven by a hormone response to food. Hear more about why the calorie is NOT king on tonight’s PeriScope. You can Katch it here with all the live stream comments and hearts at Katch.me/docmuscles.
Or you can watch the video without the comments here:
Today’s Periscope was an exciting one. Do you really need a pre- or post-workout shake or meal? How much protein do you need? What’s the difference between ketosis and ketoacidosis? Is Dr. Nally a ketogenic cheerleader? Get your answers to these and many more questions asked by some wonderful viewers this evening on today’s PeriScope.
Be sure to check out Dr. Nally’s new podcast called “KetoTalk with Jimmy and the Doc” with the veteran podcaster Jimmy Moore on KetoTalk.com. The first podcast will be available on December 31, 2015. KetoTalk with Jimmy and the Doc will be available for download for free on iTunes.
I’ve been looking for the answer for quite some time. . . what role does caffeine play in your and my weight management journey? The answer gave me a headache. . . literally and figuratively.
As many of you, including my office staff, know, I love my Diet Dr. Pepper (and my bacon). I found that being able to sip on a little soda throughout the day significantly helped the carbohydrate cravings and munchies during a busy and stressful day at the office. Diet Dr. Pepper contains caffeine, however, I wasn’t really worried. Caffeine has been well know to have a thermogenic effect which increases your metabolism and has been thought for many years to help with weight loss among the weight loss community.
Diet Dr. Pepper is, also, one of only four diet sodas on the grocery store shelves that doesn’t contain acesulfame potassium (click here to see why most artificial sweeteners cause weight gain). The four diet sodas that I have been comfortable with my patients using are Diet Dr. Pepper, Diet Coke, Diet Mug Root-beer and Diet A&W Cream Soda. These are the last four hold out diet sodas that still use NutraSweet (aspartame) as the sweetener. Most of the soda companies have switched the sweetener in their diet sodas to the insulinogenic acesulfame potassium because it tastes more natural and aspartame has been given a media black eye of late. However, NutraSweet (aspartame) is the only sweetener that doesn’t spike your insulin or raise blood sugar (click here to find out why that is important).
Yes, I know. The ingestion of 600 times the approved amount of aspartame causes blindness in lab rats (but we’re not lab rats, and . . . have you ever met someone that drinks 600 Diet Dr. Peppers in a day? The lethal dose of bananas, which are high in potassium that will stop your heart, is 400). Aspartame can also exacerbate headaches in some (about 5% of people) and I’ve had a few patients with amplified fibromyalgia symptoms when they use aspartame. But for most of us, its a useful sweetener that doesn’t spike your insulin response, halting or causing weight gain.
But, over the last few years, I’ve noticed that increased amounts of Diet Dr. Pepper & Diet Coke seem to cause plateauing of weight and decreasing the ability to shift into ketosis, especially mine. I’ve also noticed (in my personal n=1 experimentation) that my ability to fast after using caffeine regularly seems to be less tolerable, causing headaches and fatigue 8-10 hours into the fast, symptoms that don’t seem to let up until eating. Through the process of elimination, caffeine seems to be the culprit.
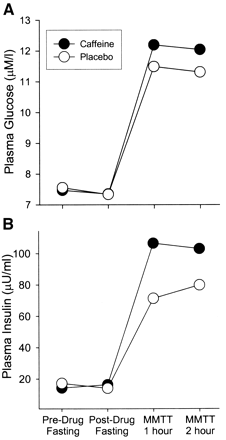
After mulling through the last 10 years of caffeine research, most of which were small studies, had mixed results, used coffee as the caffeine delivery system (coffee has over 50 trace minerals that has the potential to skew the results based on the brand) and never seemed to ask the right questions, the ink from a study in the August 2004 Diabetes Care Journal screamed for my attention.
It appears that caffeine actually stimulates a glucose and insulin response through a secondary mechanism. The insulin surge and glucose response is dramatically amplified in patients who are insulin resistant. Caffeine doesn’t effect glucose or insulin if taken while fasting; however, when taken with a meal, glucose responses are 21% higher than normal, and insulin responses are 48% higher in the insulin resistant patient. Caffeine seems to only effect the postprandial (2 hours after a meal) glucose and insulin levels. The literature shows mixed responses in patients when caffeine is in coffee or tea, probably due to the effect of other organic compounds (1).
Caffeine effect on plasma glucose and plasma insulin compared to placebo (1).
Caffeine also diminishes insulin sensitivity and impairs glucose tolerance in normal and already insulin resistant and/or obese patients. This is seen most prominently in patients with diabetes mellitus type II (stage IV insulin resistance). Caffeine causes alterations in glucose homeostasis by decreasing glucose uptake into skeletal muscle, thereby causing elevations in blood glucose concentration and causing an insulin release (2-6).
Studies show that caffeine causes a five fold increase in epinephrine and a smaller, but significant, norepinephrine release. The diminished insulin sensitivity and exaggerated insulin response appears to be mediated by a catacholamine (epinephrine, norepinephrine & dopamine) induced stress response (5). Caffeine has a half life of about 6 hours, that means the caffeine in your system could cause a catacholamine response for up to 72 hours depending upon the amount of caffeine you ingest (7).
The reason for my, and other patient’s, headaches and fatigue after a short fast was due to the exaggerated stress hormone response. Increased levels of insulin were induced by a catacholamine cascade after caffeine ingestion with a meal, dramatically more amplified in a person like me with insulin resistance. The caffeine with the last meal cause hypoglycemia 5-7 hours into the fasting, leading to headaches and fatigue that are only alleviated by eating.
Even when not fasting, the caffeine induced catacholamine cascade causes up to 48% more insulin release with a meal, halting weight loss and in some cases, causing weight gain.
Caffeine is not the “Wonder-Boy” we thought it was.
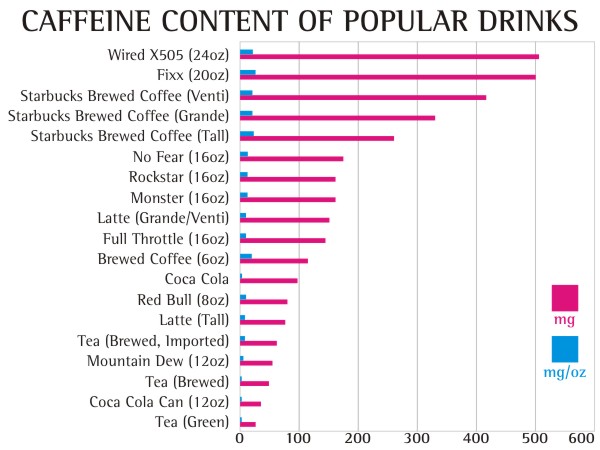
How much caffeine will cause these symptoms? 50 mg or more per day can have these effects.
10,000 mg (10 grams) – lethal dose (Yes, 25 cups of Starbucks Coffee can kill you)
The equivalent of 100 mg of in a human was given to a spider, you can see the very interesting effect on productivity. How often does the productivity of the day feel like the image below?
Normal Spider (9)Spider on caffeine (9)
Beware that caffeine is now being added to a number of skin care products including wrinkle creams and makeup. Yes, caffeine is absorbed through the skin, so check the ingredients on your skin care products.
Diet Dr. Pepper, my caffeine delivery system of choice, has slightly less caffeine (39 mg per 12 oz can or 3.25 mg per oz) than regular Dr. Pepper. I found myself drinking 2-3 liters of Diet Dr. Pepper per day (long 16-18 hour work days in the office). After doing my research, I realized that my caffeine tolerance had built up to quite a significant level (230-350 grams per day).
So, a few weeks ago, I quit . . . cold turkey.
Did I mention the 15 withdrawal symptoms of caffeine? (8)
Headache – behind the eyes to the back of the head
Sleepiness – can’t keep your eyes open kind of sleepiness
Irritability – everyone around you thinks you’ve become a bear
Lethargy – feels like your wearing a 70 lb lead vest
Constipation – do I really need to explain this one?
Depression – you may actually feel like giving up on life
Muscle Pain, Stiffness, Cramping – feel like you were run over by a train
Lack of Concentration – don’t plan on studying, doing your taxes or performing brain surgery during this period
Flu Like Illness – sinus pressure and stuffiness that just won’t clear
Insomnia – you feel sleepy, but you can’t sleep
Nausea & Vomiting – You may loose your appetite
Anxiety – amplified panic attacks or feeling like the sky is falling
Brain Fog – can’t hold coherent thoughts or difficulty with common tasks
I experienced 13 of the 15 that lasted for 4 days. I do not recommend quitting cold turkey unless you have a week off and someone to hold your hand, cook your meals and dose your Tylenol or Motrin. My wife thought I was dying. . . I thought I was dying on day two. I actually had a nightmare about buying and getting into my own coffin. It can take up to three weeks to completely recover from caffeine withdrawal.
The other way to quit is to decrease your caffeine intake by 50 mg every two days. That means decrease caffeine by:
1 can of soda every two days
1/4 cup of coffee every day
1/2 can of Energy Drinks every two days
1 cup of tea every two days
The benefit of this method is that withdrawal symptoms are much less severe without the caffeine headache and the ability to remain productive. It will take longer, but quitting cold turkey is not a pretty picture. Been there . . . done that, . . . and I’m not going back. I actually lost another half inch off my waistline by day 5 of caffeine discontinuation.
What is the take home message here? If you have any degree of insulin resistance, caffeine makes it worse and will amplify your weight gain as well as decrease the productivity of your day.
What laboratory testing is necessary when you start your weight loss journey on a Ketogenic, Low-Carbohydrate, Paleolithic or any other dietary changes? Why do you need them and what are you looking for? We discuss these questions and others on today’s PeriScope. Lots of questions from around the world to day . . . this one lasted a bit longer than normal . . . 45 minutes to be specific. But it’s a good one because of all of your fantastic questions! You really don’t want to miss this one.
You can see the video below or watch the video combined with the rolling comments here on Katch.me/docmuscles.
A list of the labs that we discussed are listed below:
Fasting insulin with 100 gram 2 or 3 hour glucose tolerance test with insulin assay every hour
CMP
CBC
HbA1c
Leptin
Adiponectin
C-Peptid
NMR Liprofile or Cardio IQ test
Lipid Panel
Urinalysis
Microalbumin
Apo B
C-reactive protein
TSH
Thyroid panel
Thyroid antibodies
AM Cortisol
This list will at least get one started, provide the screening necessary to identify insulin resistance (Diabetes In-Situ), Impaired fasting glucose, diabetes and allow for screening for a number of the less common causes of obesity.
I would highly recommend that you get these through your physician’s office so that appropriate follow up can be completed. These labs will need to be interpreted by your physician, someone who understands and is familiar with various causes of obesity.
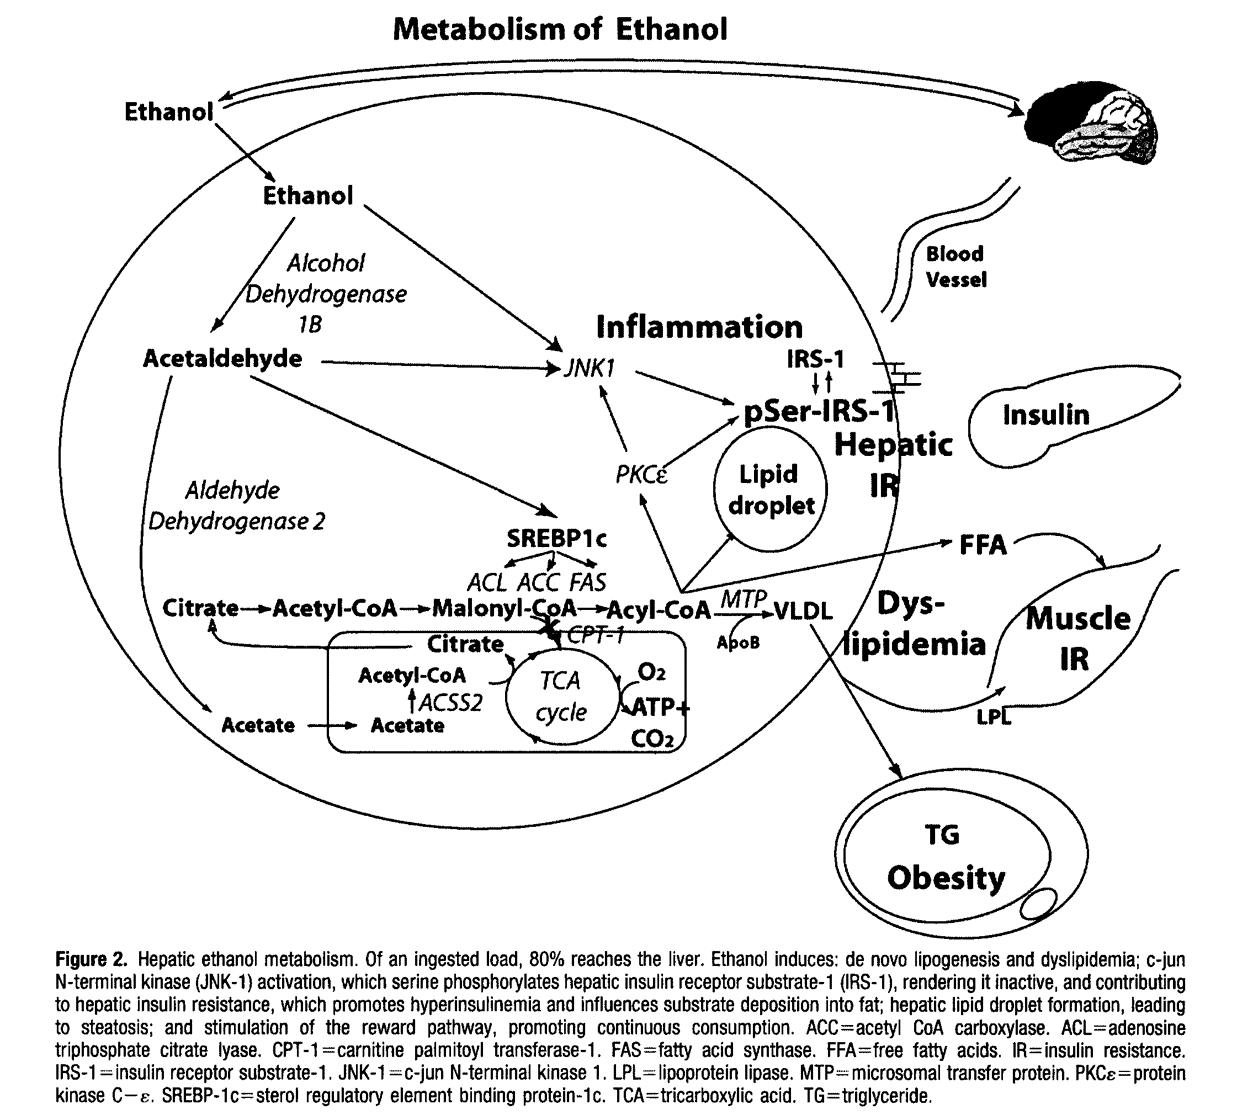
Yes, your fruit makes you fat just like your beer gives you a beer belly. . .
It is fascinating how similarly fructose (the sugar in fruit) and alcohol are processed through the liver. Both of them increase insulin and both increase triglyceride production as a byproduct of their metabolism. This is clearly pointed out in Robert Lustig’s paper published in the Journal of the American Dietetic Association in 2010.
The metabolic pathways are very clearly outlined below:
You can Katch my PeriScope conversation about this below or with the comments and hearts included at Katch.me/docmuscles.
Diseases seem to arrive in three’s each day in my office. Today I had three different patients with cholesterol concerns who were notably confused about what actually makes the cholesterol worse, and what causes weight gain. Each of them, like many patients that I see, were stuck in a state of confusion between low fat and low carbohydrate lifestyle change. My hope is to give my patients and anyone reading this blog a little more clarity regarding what cholesterol is, how it is influenced and how it affect our individual health.
First, the standard cholesterol profile does not give us a true picture of what is occurring at a cellular level. The standard cholesterol panel includes: total cholesterol (all the forms of cholesterol), HDL (the good stuff), LDL-C (the “bad” stuff) and triglycerides. It is important to recognize that the “-C” in these measurements stands for “a calculation” usually completed by the lab, and not an actual measurement. Total cholesterol, HDL-C and triglycerides are usually measured and LDL-C is calculated using the Friedewald equation [LDL = total cholesterol – HDL – (triglycerides/5)]. (No, there won’t be a quiz on this at the end . . . so relax.)
However, an ever increasing body evidence reveals that the concentration and size of the LDL particles correlates much more powerfully to the degree of atherosclerosis progression (arterial blockage) than the calculated LDL concentration or weight (1, 2, 3).
There are three sub-types of LDL that we each need to be aware of: Large “fluffy” LDL particles (type I), medium LDL particles (type II & III), and small dense LDL particles (type IV).
Weight & Size of VLDL, LDL & HDL
Why LDL-C is misleading: Identical LDL-C of 130 mg/dL can have a low risk (Pattern A) with a few “big fluffy LDL particles or high risk (Pattern B) with many small dense LDL particles.
Second, it is important to realize that HDL and LDL types are actually transport molecules for triglyceride – they are essentially buses for the triglycerides (the passengers). HDL can be simplistically thought of as taking triglycerides to the fat cells and LDL can be thought of as taking triglycerides from the fat cells to the muscles and other organs for use as fuel.
Third, it is the small dense LDL particles that are more easily oxidized and because of their size, are more likely to cause damage to the lining of the blood vessel leading to damage and blockage. The large boyant LDL (“big fluffy LDL particles”) contain more Vitamin E and are much less susceptible to oxidation and vascular wall damage.
Eating more fat or cholesterol DOES NOT raise small dense LDL particle number. Eating eggs, bacon and cheese does not raise your cholesterol! What increases small dense LDL particles then? It is the presence of higher levels of insulin. Insulin is increased because of carbohydrate (sugars, starches or fruits) ingestion. It is the bread or the oatmeal you eat with the bacon that is the culprit. The bread or starch stimulates and insulin response. Insulin stimulates the production of triglycerides and “calls out more small buses” to transport the increased triglyceride to the fat cells (4, 5, 6, 7).
Fourth, following a very low carbohydrate diet or ketogenic diet has been demonstrated to decreased small dense LDL particle number and correlates with a regression in vascular blockage (8, 9). So, what does this really mean to you and me? It means that the low-fat diet dogma that that has been touted from the rooftops and plastered across the cover of every magazine and health journal for the last 50 years is wrong. . . absolutely wrong.
I talk about this and answers questions on today’s Periscope. You can see the recording on Katch.me with the comments in real time here:
Superko HR, Gadesam RR. Is it LDL particle size or number that correlates with risk for cardiovascular disease? Curr Atheroscler Rep. 2008 Oct;10(5):377-85. PMID: 18706278
Rizzo M, Berneis K. Low-density lipoprotein size and cardiovascular risk assessment. QJM. 2006 Jan;99(1):1-14. PMID: 16371404
Rizzo M, Berneis K, Corrado E, Novo S. The significance of low-density-lipoproteins size in vascular diseases. Int Angiol. 2006 Mar;25(1):4-9. PMID:16520717
Howard BV, Wylie-Rosett J. Sugar and cardiovascular disease: A statement for healthcare professionals from the Committee on Nutrition of the Council on Nutrition, Physical Activity, and Metabolism of the American Heart Association. Circulation. 2002 Jul 23;106(4):523-7. PMID: 12135957
Elkeles RS. Blood glucose and coronary heart disease. European Heart Journal (2000) 21, 1735–1737 doi:10.1053/euhj.2000.2331
Stanhope KL, Bremer AA, Medici V, et al. Consumption of Fructose and High Fructose Corn Syrup Increase Postprandial Triglycerides, LDL-Cholesterol, and Apolipoprotein-B in Young Men and Women. The Journal of Clinical Endocrinology and Metabolism. 2011;96(10):E1596-E1605.
Shai I et al. Cirulation. 2010; 121:1200-1208
Krauss RM, et al. Prevalence of LDL subclass pattern B as a function of dietary carbohydrate content for each experimental diet before and after weight loss and stabilization with the diets. American Journal of Clinical Nutrition. 2006; 83:1025-1031
Gentile M, Panico S, et al., Clinica Chimica Acta, 2013, Association between small dense LDL and early atherosclerosis in a sample of menopausal women, Department of Clinical Medicine and Surgery, University “Federico II” Medical School, Naples, Italy Division of Cardiology, Moscati Hospital, Aversa, Italy A. Cardarelli Hospital, Naples, Italy
In light of the fact that exercise DOES NOT cause weight loss, exercise has a fascinating ability to enhance ketosis. No, seriously, I don’t care what your trainer told you, you won’t loose weight with exercise, no mater how hard you try. However, exercise does help you body attain a ketogenic state.
When you exercise, the muscles take up glucose and oxygen to burn as their primary fuel. Exercise has actually been shown to enhance this process and reduce the “insulin resistance” effect that the the SAD diet (Standard American Diet) has on 2/3rds of the population (whether they realize it or not). Mild to moderate exercise like a walk or even a mild jog, and resistance training like weight lifting, yoga or Pilates increased the drive of the glucose into the cells and improves the ability of the cells to use the glucose.
In a person following a carbohydrate restricted diet (Ketogenic, Low-Carb, and even Paleolithic to some degree), the body maintains a stable level of blood sugar by releasing glycogen from the liver and gluconeogenisis as needed to support the 100 grams necessary per day required by the brain (the liver makes about 240 grams per day no mater what you do). In the absence of extra glucose as fuel, the body will then use triglyceride and/or ketones as fuel. Exercise improves the sensitivity to the small amount of glucose and actually ramps up the presence of ketones placing the person into a more ketogenic state.
This enhanced ketogensis is often experienced as “second wind” or “being in the zone” or even as an ability to “hyperfocus” during exercise. But the exercise levels must be in the mild to moderate range for this to be accomplished.
But, there’s a fine balance, if the muscles are pushed too hard to fast, lactic acid builds up because of a shift to an anaerobic state and the acid creates a stress response, triggering cortisol and increased glucose formulation, causing one to shift out of ketosis.
How do you know if you exercising too hard? You should be exercising hard enough to break a sweat, but not so hard that you can’t carry on a conversation with your partner at the same time. Over time, as the body becomes more effective at using ketones, you’ll find your exercise intensity can and will improve.
See Dr. Nally try to explain all this while riding his horse Bailey in the White Tank Mountains:
Or you can Katch it here: https://katch.me/docmuscles/v/ce43292a-296f-3de4-bf6f-d19cd688fc62

 After mulling through the last 10 years of caffeine research, most of which were small studies, had mixed results, used coffee as the caffeine delivery system (coffee has over 50 trace minerals that has the potential to skew the results based on the brand) and never seemed to ask the right questions, the ink from a study in the